
File:Recent Sea Level Rise.png
| |
This is a file from the Wikimedia Commons. Information from its description page there is shown below.
Commons is a freely licensed media file repository. You can help. |
Contents |
Summary
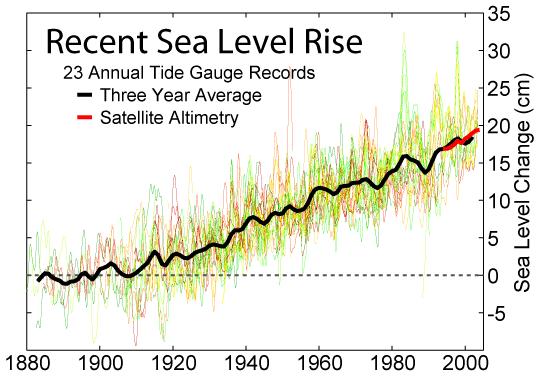
This figure shows the change in annually averaged sea level at 23 geologically stable tide gauge sites with long-term records as selected by Douglas (1997). The thick dark line is a three-year moving average of the instrumental records. This data indicates a sea level rise of ~27.5 cm from 1800-2000. Because of the limited geographic coverage of these records, it is not obvious whether the apparent decadal fluctuations represent true variations in global sea level or merely variations across regions that are not resolved.
For comparison, the recent annually averaged satellite altimetry data from TOPEX/Poseidon are shown in red. These data indicate a somewhat higher rate of increase than tide gauge data, however the source of this discrepancy is not obvious. It may represent systematic error in the satellite record and/or incomplete geographic sampling in the tide gauge record. The month to month scatter on the satellite measurements is roughly the thickness of the plotted red curve.
Data
Original data for this figure is from the Permanent Service for Mean Sea Level (PSMSL). Douglas (1997), defined the following criteria for selecting records from the PSMSL which were long, reliable, and avoided large vertical geologic changes:
- Each record should be at least 60 years in length
- Not be located at collisional plate boundaries
- At least 80% complete
- Show reasonable agreement at low frequencies with nearby gauges sampling the same water mass
- Not be located in regions subject to large post-glacial rebound
He subsequently identified 24 PSMSL records meeting all five of these criteria:
- Newlyn, Cornwall, 1915-2003
After slight corrections following Douglas (1997) for any remaining post-glacial rebound at these sites (typically ~3 cm/century), the tide gauge data from these sites were plotted in no particular order as the thin lines in the above figure. One site, Wellington, was omitted because the author of this figure was unable to locate the corresponding record from the PSMSL.
Copyright
This figure was prepared from publicly available data by Robert A. Rohde and is incorporated into the Global Warming Art project.
 |
Permission is granted to copy, distribute and/or modify this document under the terms of the GNU Free Documentation License, Version 1.2 or any later version published by the Free Software Foundation; with no Invariant Sections, no Front-Cover Texts, and no Back-Cover Texts. A copy of the license is included in the section entitled GNU Free Documentation License.
|
| This file is licensed under the Creative Commons Attribution-Share Alike 3.0 Unported license. | ||
|
||
| This licensing tag was added to this file as part of the GFDL licensing update.
|
Reference
Bruce C. Douglas (1997). "Global Sea Rise: A Redetermination". Surveys in Geophysics 18: 279–292. DOI: 10.1023/A:1006544227856.
File usage
Metadata
Did you know...?
Wikipedia for Schools was collected by SOS Children's Villages. By supporting vulnerable children right through to adulthood, SOS Children's Villages makes a lasting difference to the lives of thousands of people. Education is a key part of our work, and our schools provide high-quality teaching to the children in our care. Have you thought about sponsoring a child?