
File:European Output of Printed Books ca. 1450–1800.png
Size of this preview: 564 × 479 pixels.
| |
This is a file from the Wikimedia Commons. Information from its description page there is shown below.
Commons is a freely licensed media file repository. You can help. |
Summary
| Description |
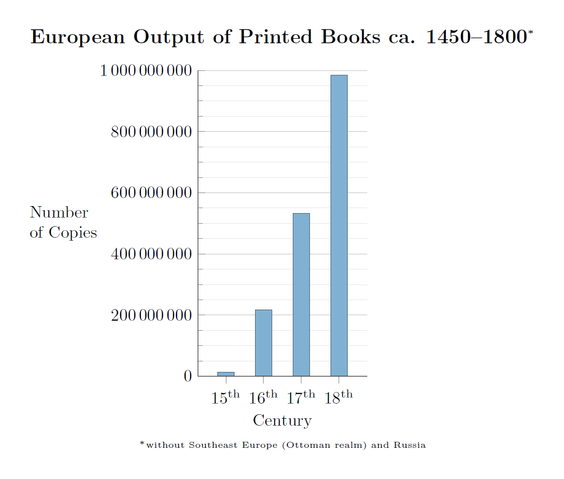
Deutsch: Geschätzte Buchdruckproduktion in Europa von ca. 1450 bis 1800. Ein Buch ist definiert als ein Druckwerk von mehr als 49 Seiten.
English: Estimated output of printed books in Europe from ca. 1450 to 1800. A book is defined as printed matter containing more than 49 pages.
|
| Date | 16 December 2011 |
| Source | Own work |
| Author | Tentotwo Data from: Buringh, Eltjo; van Zanden, Jan Luiten: "Charting the “Rise of the West”: Manuscripts and Printed Books in Europe, A Long-Term Perspective from the Sixth through Eighteenth Centuries", The Journal of Economic History, Vol. 69, No. 2 (2009), pp. 409–445 (417, table 2) |
LaTeX source
\documentclass[border=5mm]{standalone}
\usepackage{pgfplots}
\usepackage[super]{nth}
\usepackage{amsmath}
\pgfplotstableread{
Century Manuscripts Books
6       13552           nan
7       10639           nan
8       43702           nan
9       201742  nan
10      135637  nan
11      212030  nan
12      768721  nan
13      1761951 nan
14      2746951 nan
15      4999161 12589000
16       nan            217444000
17      nan             531941000
18      nan             983874000
}\datatable

\definecolor{RYB1}{RGB}{128, 177, 211}

\begin{document}
\begin{tikzpicture}
  \begin{axis}[
        x=0.7895cm,
        axis on top=false, grid=both, xmajorgrids=false, xminorgrids=false, every minor grid/.style=gray!20,
        minor y tick num=3,
        axis lines*=left,
        width=12cm, height=8cm, enlarge x limits=0.25,
        ymin=0, ymax=1e9, scaled y ticks=false,
        yticklabel={\pgfmathprintnumber[fixed, set thousands separator=\,]{\tick}},
        enlarge y limits=false,
        ybar=-10pt, xtick={15,...,19}, xticklabel={\pgfmathparse{int(\tick)}\nth{\pgfmathresult}},
        xlabel=Century, xlabel style={yshift=-1ex},ylabel=Number\\ of Copies,
         ylabel style={rotate=-90, align=left, anchor=east, xshift=-5ex, name=ylabel},
        title={European Output of Printed Books ca. 1450--1800$^{\text{\tiny{*}}}$},
        title style={font=\large\bfseries, align=centre,yshift=1ex}
        ]

\addplot +[fill=RYB1, draw=RYB1!50!black] table [y=Books] {\datatable};
\draw (rel axis cs:0,0) -- (rel axis cs:1,0);
  \end{axis}
\node at (current axis.below south) [anchor=north, align=left, font=\tiny] {$^*$without Southeast Europe (Ottoman realm) and Russia};

\end{tikzpicture}
\end{document}
Licensing
|
File usage
The following pages on Schools Wikipedia link to this image (list may be incomplete):
About Schools Wikipedia
Wikipedia for Schools is one of SOS Children's many educational projects. SOS Childrens Villages believes education is an important part of a child's life. That's why we ensure they receive nursery care as well as high-quality primary and secondary education. When they leave school, we support the children in our care as they progress to vocational training or higher education. Have you heard about child sponsorship? Visit our web site to find out.